Customer Shopping Behavior Analysis
Transforming 3,900+ retail consumer transactions into clear behavioral segmentation and commercial growth strategies.
A retail business had thousands of customer transactions but lacked visibility into what drives repeat purchases, which customer age groups generate the highest revenue, and whether discount promotions actually improve margins. Using Python for data cleaning, advanced SQL for demographic segmentation, and Power BI for interactive dashboard visualization, I uncovered critical behavioral patterns—revealing that Clothing ($43K) & Accessories ($31K) drive over 75% of sales, while Young Adults form the primary revenue pillar. These insights were translated into 5 actionable commercial strategies.
Data Rich, Decision Blind
Why having raw sales records without structured analytics leads to wasted ad spend and missed revenue.
Demographic Blind Spots
The business couldn't quantify which age brackets or customer genders generated the highest Average Order Value (AOV). Marketing budgets were spent universally rather than focused on high-yielding cohorts.
Discount Cannibalization
Promotional discounts were handed out broadly without analyzing whether they attracted profitable high-spend buyers or simply eroded profit margins on price-sensitive bargain hunters.
Lack of Customer Segmentation
There was no systematic classification to separate one-time buyers from returning and high-loyalty shoppers, making it impossible to tailor retention emails or VIP loyalty programs effectively.
From Raw Data to Business Clarity
A structured, reproducible pipeline turning messy retail records into interactive executive dashboards.
Data Cleaning (Python & Pandas)
Cleaned 3,900 raw transaction records: audited missing data, standardized categorical fields, engineered age bracket columns (Young Adult, Adult, Middle-aged, Senior), and exported clean CSVs.
Deep SQL Querying & Modeling
Authored 10 specialized SQL scripts using CTEs, Window Functions (ROW_NUMBER), subqueries, and CASE statements to isolate high-value buyers and category leaders.
Interactive Power BI Dashboard
Constructed an interactive BI report with dynamic slicers (Subscription, Gender, Category, Shipping Type), KPI cards, and category revenue ranking charts.
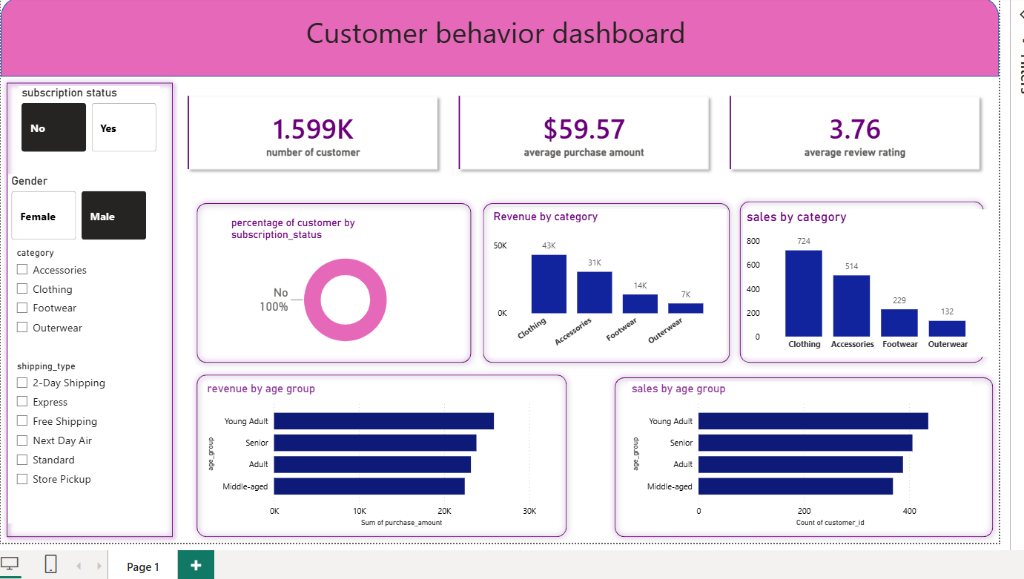
Customer Behavior Dashboard Breakdown
A high-level view of customer volume, purchasing power, category distribution, and demographic trends.
Commercial Patterns Revealed
The dashboard enables instant slicing by Subscription Status, Gender (Female vs. Male), Product Category, and Shipping Method to isolate profit drivers.
Key Analytical Findings (SQL Insights)
10 SQL queries answered critical business questions regarding customer lifetime value and promotion efficiency.
Revenue by Gender Split
Analyzed revenue across gender segments, establishing baseline order values to evaluate whether ad creatives should be split or unified.
"Smart Discount" Shoppers
Identified customers who applied discount codes but still maintained an Average Order Value above the $59.57 benchmark—representing high-value shoppers worth VIP perks.
Top-Rated Flagship Items
Ranked top 5 products by customer review rating (>4.0 score) to feature as hero items in promotional banners and social proof ads.
Express Shipping Correlation
Discovered that shoppers who select Express Shipping demonstrate a significantly higher average cart spend than Standard and Store Pickup users.
Subscription Program ROI
Benchmarked transaction volume between subscribed and non-subscribed buyers, validating that loyalty subscribers yield stronger recurring lifetime value.
3-Tier Customer Segmentation
Used a SQL CTE to segment the customer base into New (1 purchase), Returning (2–10 purchases), and Loyal (>10 purchases) cohorts for targeted marketing.
Age Demographic Hierarchy
Ranked revenue generation by age cohort: Young Adults ($26K+) > Seniors ($24K) > Adults ($23K) > Middle-aged ($22K).
Category Bestsellers via Window Functions
Applied ROW_NUMBER() OVER (PARTITION BY Category ORDER BY TotalSales DESC) to extract the top 3 best-selling products per department.
5 Actionable Business Recommendations
Data-backed initiatives designed for leadership to optimize retail operations and improve retention.
Launch VIP Perks for "Smart Discount" Buyers
Rather than generic discount coupons, reward customers who spend above $60 with exclusive early-access perks and loyalty points to safeguard gross margins.
Focus Marketing on Young Adults & Seniors
Concentrate paid social ad budgets on Young Adults (highest volume) and Seniors (consistent high cart values) with tailored product collections.
Convert "Returning" Shoppers to "Loyal"
Automate personalized re-engagement emails for shoppers with 2–5 purchases, introducing cross-category product recommendations from Clothing and Accessories.
Offer Free Express Shipping Threshold
Since Express shipping buyers spend more, set a free Express Shipping threshold at $75+ to incentivize larger basket sizes and increase AOV.
Promote Category Bestsellers on Homepage
Feature the top 3 best-selling products identified in each category on the store homepage and in email marketing to leverage proven social proof.
Turning Transactional Data into Commercial Strategy
This case study demonstrates the core value of a Business-Oriented Data Analyst: taking raw, messy transaction records and translating them through Python cleaning, advanced SQL querying, and Power BI visualization into concrete commercial decisions that business leaders can execute immediately to drive revenue and customer retention.